
URL Analysis w/ URLScan - Indication of Compromise

As I'm currently attending a conference I've been enjoying the variety of talks and presentations. But one problem I tend to encounter frequently is the practical application of certain actions described in these talks is lacking.
Many talks at conferences explain the ‘why’ behind threats, but rarely the ‘how’ behind the analysis. Thus, in an effort to share knowledge, I had a great conversation with a fellow analyst and demonstrated how I utilize URLScan.io to go about analyzing a given URL for script loads, bad content, and typical indicators of compromise.
This process is typically triggered by a threat hunt, a user reporting a website being blocked, or a malicious URL from an email.
URLScan.io and It's Usage
Our first example is going to focus on the usage of a particular tool called URLScan.io. URLScan allows us to, as the name suggests, scan a URL to see the content on the site and what loads on the site, and where it loads from. It does this safely via a sandbox environment, so you never have to expose your host machine. This is helpful in identifying potential phishing sites or see malicious script loads without you having to visit the website yourself and potentially generate alerts on your device.
For our initial scan, I'm going to utilize my blog site: austincoats.com, but will also take examples of Public URLScan results.
From the output of URLScan, we have a variety of points to look at and review.
1. The Summary Section
The Summary section provides the general information for the website such as the IP address, a screenshot, and IP/Domain details of loaded content. This is a good overview, but most of the interest will be in the next sections.
2. The HTTP Section.
This contains a more detailed breakdown of files loaded on the webpage, their URLs, IPs, and the script response content. This will be our primary focus point for the sake of most site compromises, especially with WordPress sites.
3. The Similar Section.
This section will contain items that look similar to the submitted site. This is handy for comparing sites to see if you're looking at a potentially fraudulent site that's mimicking another site. However, you do have to sign-up for that function.
Not logged in, you get comparisons of domain, IP, and ASN. This will point out shared hosting or potential organizational infrastructure.
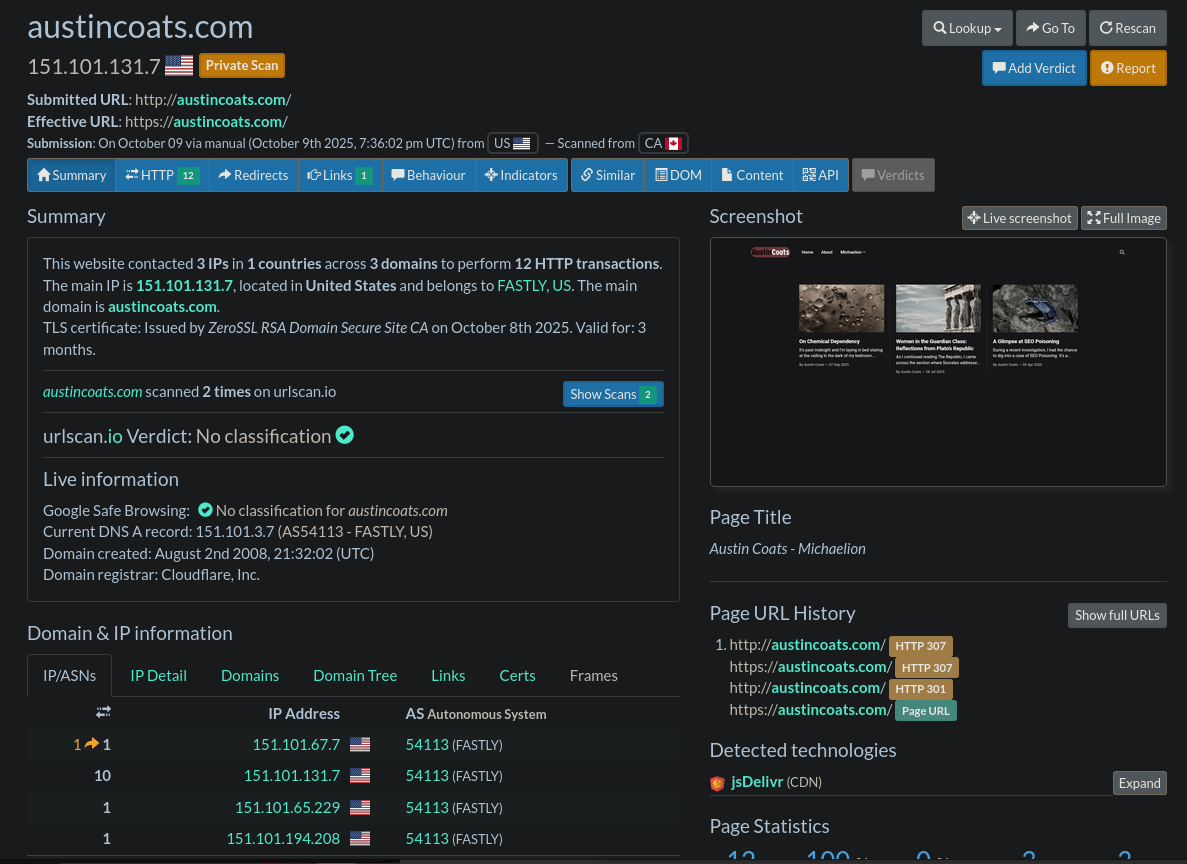
Summary, HTTP, and Similar sections within URLScan.io
In search of a potential compromise, we are interested in what the site is loading when the user visits. Lots of sites will utilize Javascript for most or all of their functionality and attackers will often add in their own malicious files, or append malicious code onto the bottom of legitimate files so that it executes after the legit file renders. Such methods are common with the ClickFix pop-ups and other malicious methods.
How do we actually go about finding this? Well, there's a variety of ways with some a bit more concrete than others. Here are the two that I primarily use:
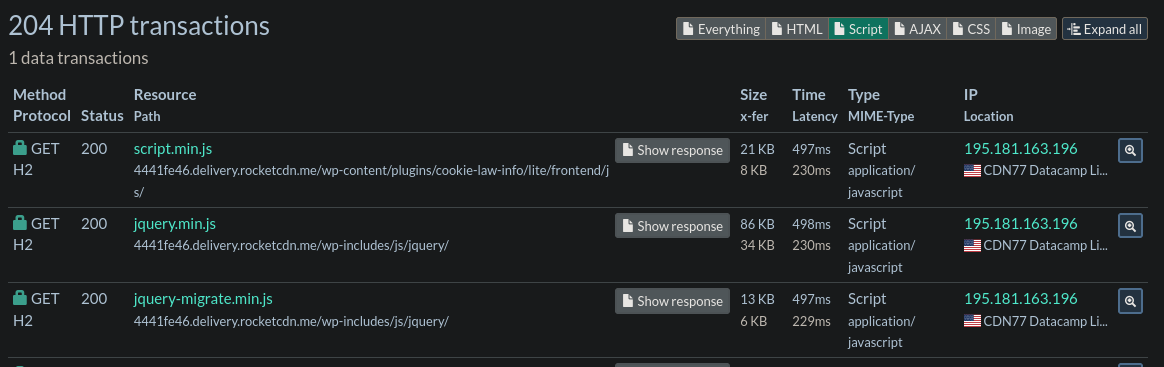
1. Resource Path of Script
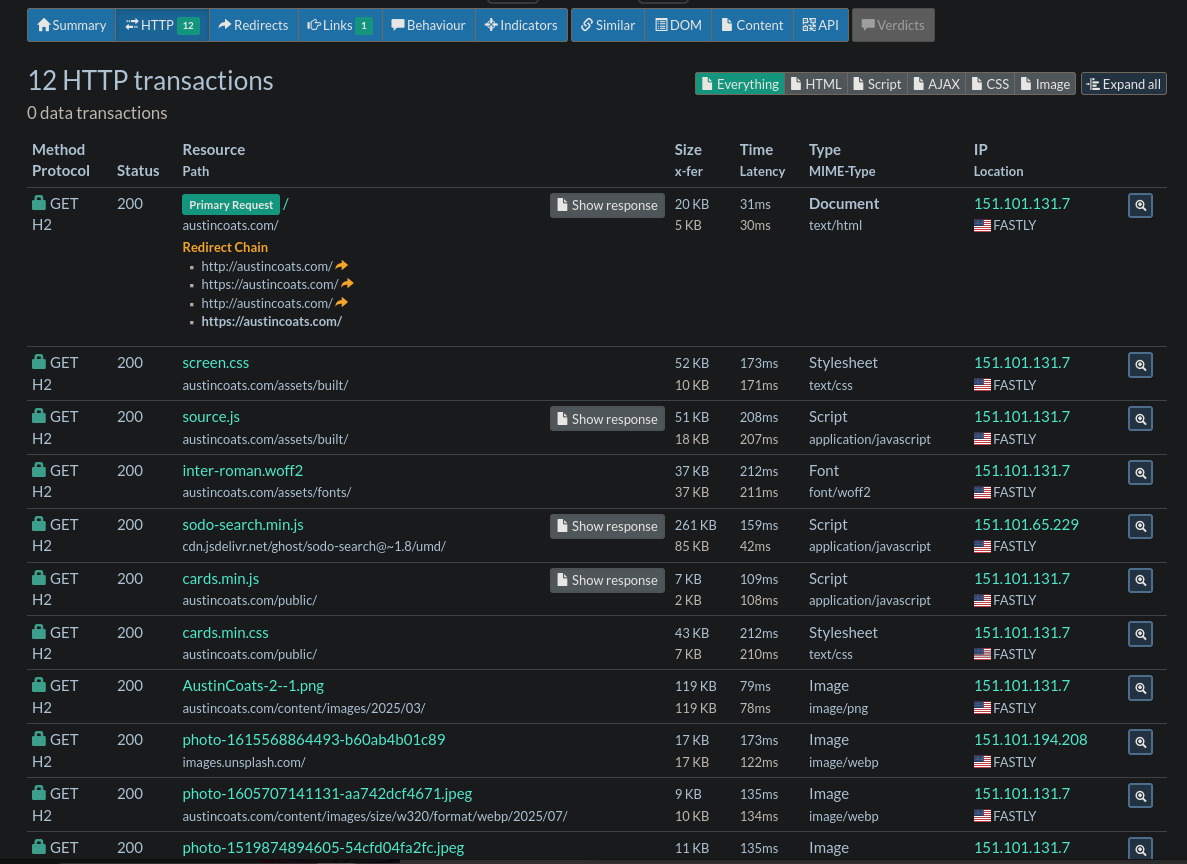
A good starting point is to look at the resource path under the HTTP section. This will indicate a remote script being loaded. However, it's common for most frameworks to pull from all over the place. After a few rounds of analysis, you'll begin to recognize and baseline what is typical for external loads and the abnormal will stand out.
Another concern is the geographical location with where the resource is hosted. While it's not a catch-all and it depends on your locale, most services will be hosted in a mix of the United States, Germany, and perhaps Ireland. If you see something abnormal being loaded, like from Russia, then it may be the culprit.
The example below demonstrates the Polish outlier on the bottom of the results. Whilst this case is legitimate, it follows the idea of what we're looking for.
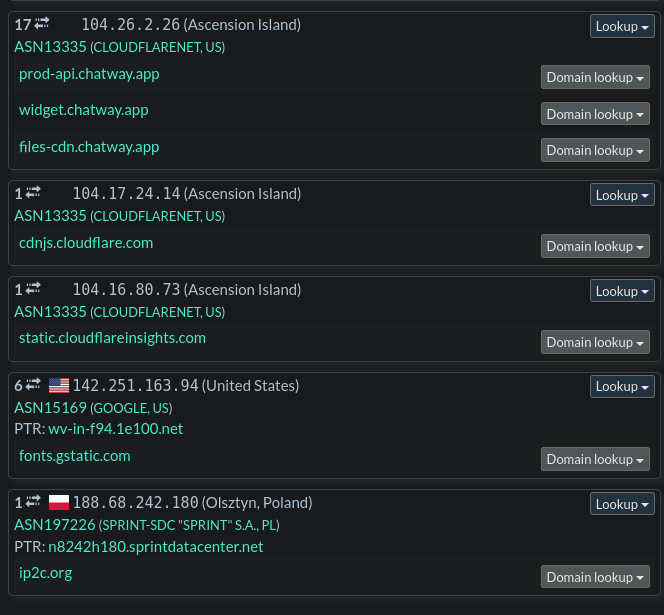
Example of abnormal geography in URLScan results.
2. Appending of Code
Our next method involves investigating otherwise legitimate files that are being loaded. From my experience, this is common with WordPress sites where pages/plugins will have additional code added by attackers in order to conduct their attack every time the page is loaded.
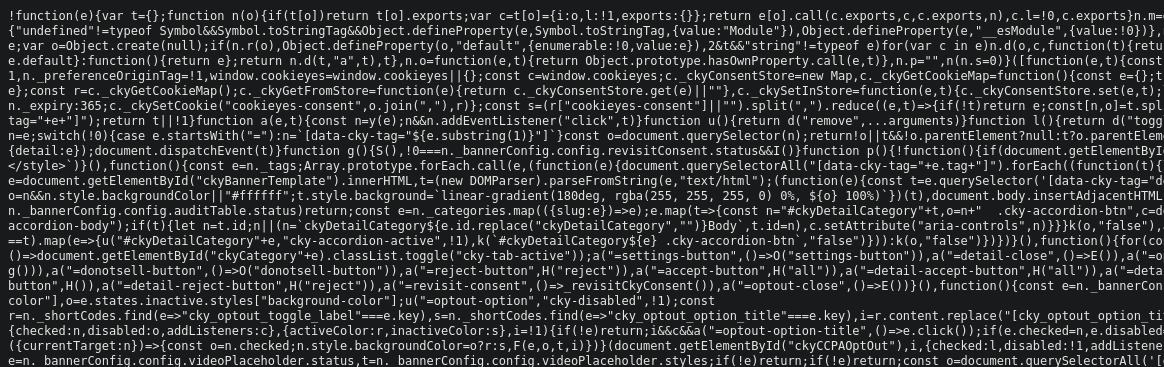
From our URLScan results under the HTTP section, we can filter specifically for Scripts only. Here, we can click Show Response which will display the contents of the script. Things to look for here are obvious obfuscation, unusual domain requests, and stuff hiding past the end of the code.
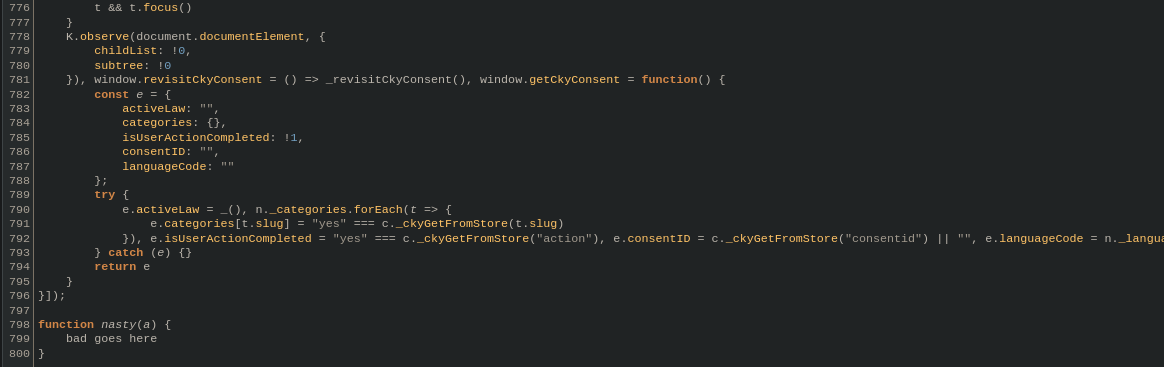
Beautifying also helps with the mess that is Javascript, as seen in the 3rd image with the appended function.
Such analysis may not always reveal the answers you are looking for. Sometimes, it's possible that the site is already remediated and that the threat data on the site has gone stale. On the flip side, it's also possible that we were just unable to identify the issue and if we are unable to verify, it's better to be on the side of caution and continue to block the site.
Practical Application Example
During a threat hunt, we had discovered unusual usage of Ngrok stemming from a user's device. However, the activity was occurring while the user was browsing the internet and going to a specific web page. As such, it was our job to investigate and understand the activity and why Ngrok was being used.
Note: The activity was benign and shared links/sites are safe.
Analysis
From our logs, we know that tehuanolabs.ngrok.app is the Ngrok hit, and ag-wx.com is the referrer page and is thus the page that led to the Ngrok site, but when we check the page in URLScan, we see no such Ngrok reference. So, it's likely buried within one of the scripts.
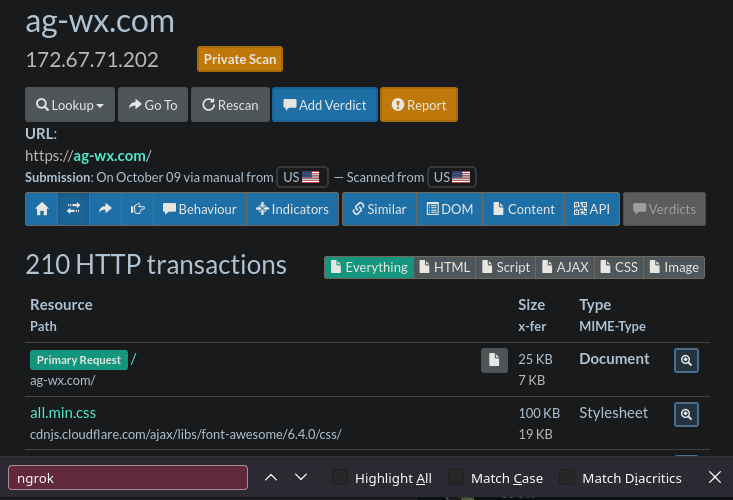
Clearly something on the website was causing this activity but we're not seeing it represented in the initial scan. However, our logs are clear on the visited URL and the Referrer.
Since we're unable to validate with the tool, we then move onto manually interacting with the site and looking at the loaded resources via the Browser's Developer Tools. Ideally, you'd want to do this in a sandbox to make sure that your host system stays safe.
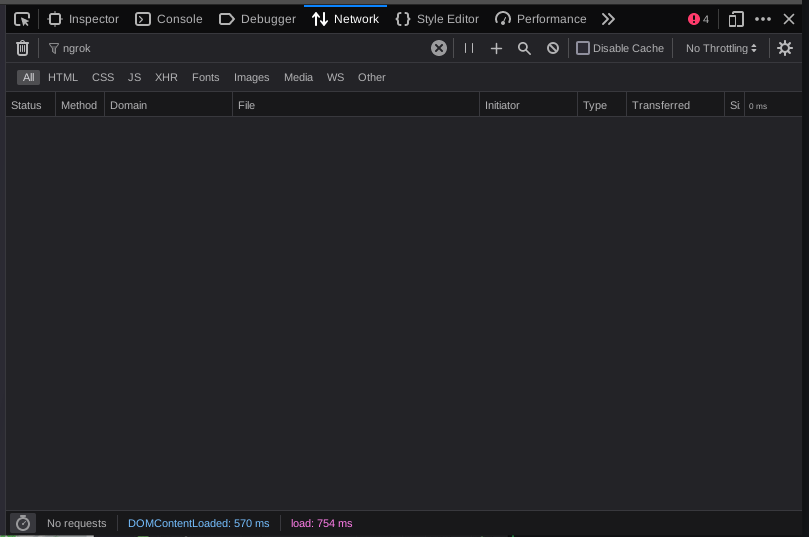
Again, checking the loaded resources... nothing. So, it seems we need to interact with the website more, so I begin to click on various pages in the menu and see what things I have to poke and play with.
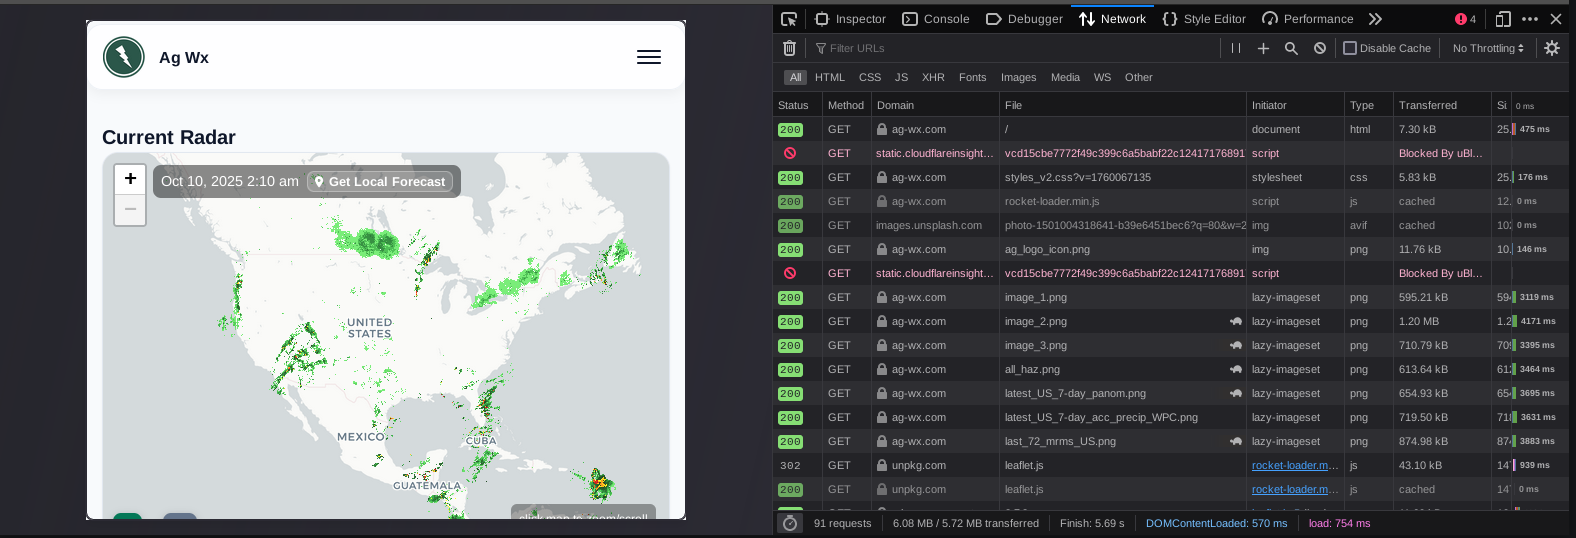
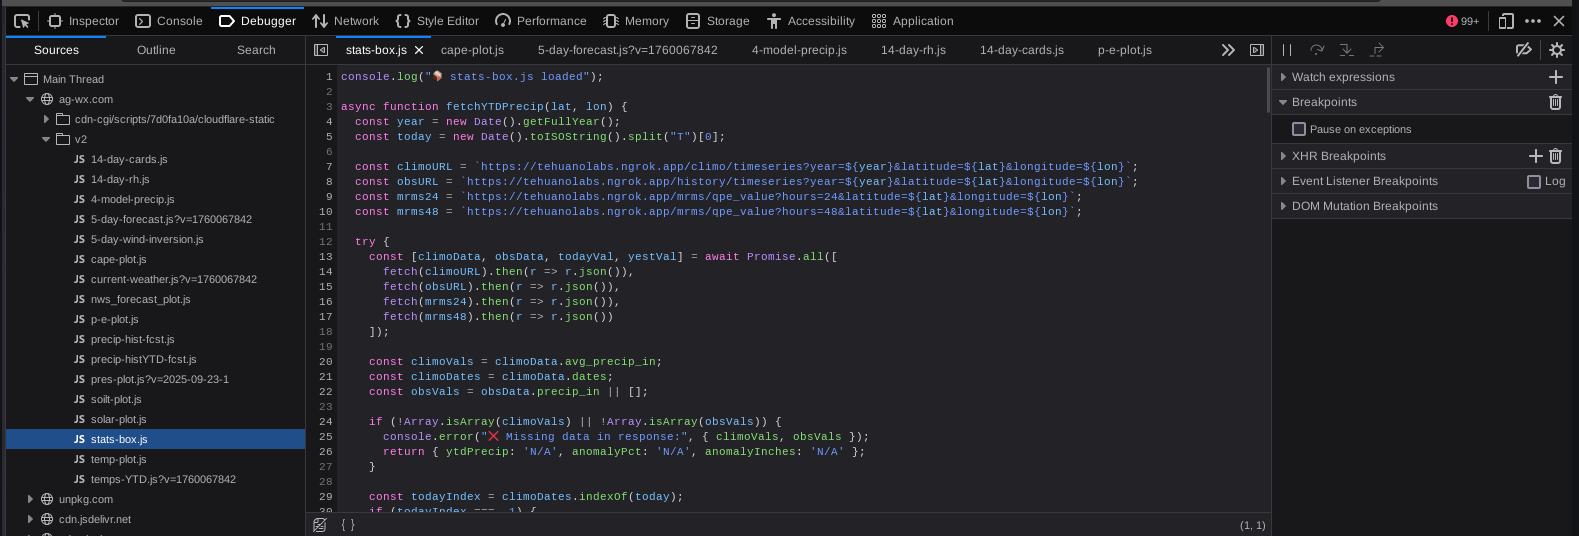
That's when I then arrive on the page: ag-wx.com/v2/local_wx
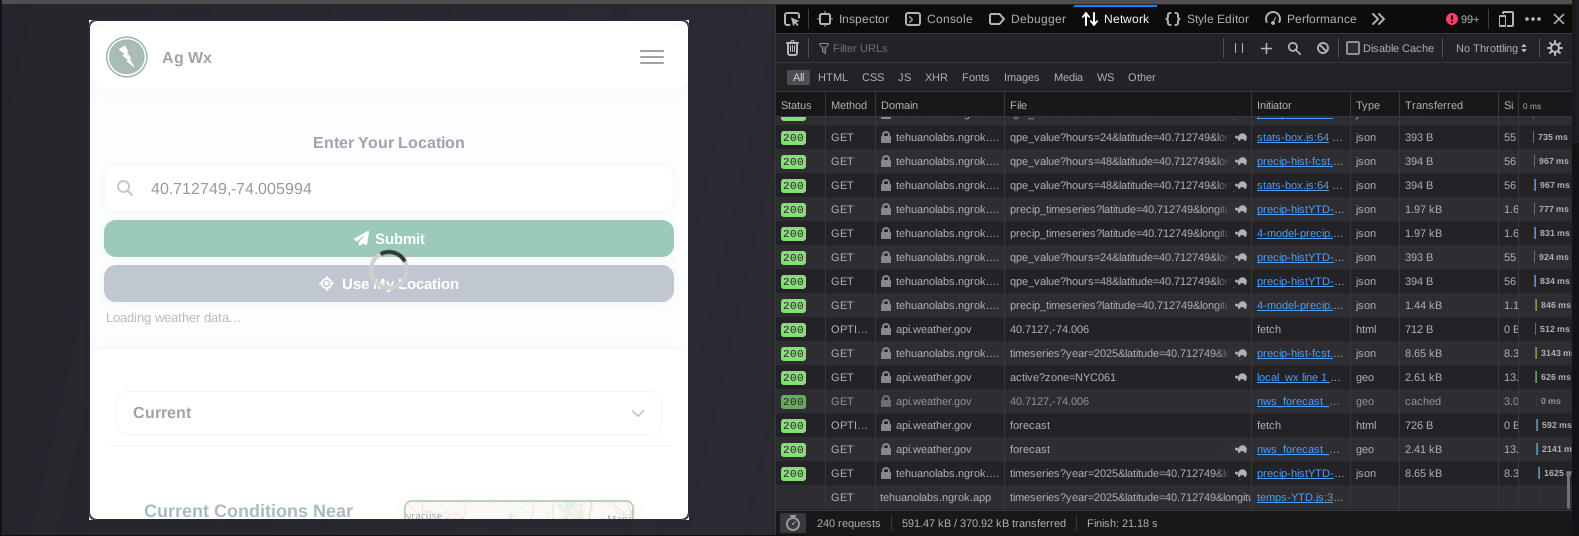
This contains a map where you input your town or zip code to get a view of local weather information. As such, since we need to poke and prod, I enter a zip code.
Ta-da, that was the missing piece. We can see the network connections to tehuanolabs.ngrok.app and the script in which the connections were originating from which we can reference in the Debugger tab. This also explained why we were seeing the Referrer value that we were, because the user didn't technically navigate to a new page but had generated the connection from the Local_Wx page after being Referred from the home page.
This allows us to see in context the usage and reason for the connection and provides us a script to review as well to see how the connection is being used. In this case, instead of using a typical api.weather.com connection for map data, they are sending it through an Ngrok tunnel to an API to send the same type of coordinate data to help populate the map.
Closing
As demonstrated, URLScan is an amazing free tool to help analyze websites, but even it has it's shortcomings at times. This showcases why it's important to know how to conduct further analysis when you are certain of activity occurring.
It's my hope that the small practical demonstration and usage of tooling was useful and a contrast to these conference talks that involve theoretical possibilities or vague recommendation.
Thank you,
~Austin